Does the Resource Buffer Pick the Genes? Three Stable Profiles Compared
Update (2026-05-12): A 6-seed-per-profile follow-up revisited these claims. The robust signal is that speciation diverges across all three profiles; the single-seed
learning_rate/ensemble_sizedirection-flip findings were not robust under replication. See When one seed disagrees with six.Update (2026-05-18): Crossover follow-up is complete. Conservative profiles show robust speciation compression under gene flow, while buffered profiles keep diverging trajectories. See Gene flow and the buffer.
A natural follow-up to the hyperparameter genome experiments
is whether the amount of food in the world changes what gets selected,
not just how many agents survive. So I ran the
intrinsic-evolution runner
three times with everything held fixed except the stable initial-conditions
profile — small adjustments to the starting resource pool, count, and regen
rate — and compared the outputs.
Short answer: yes, and in more interesting ways than I expected. The
direction of selection on most ecological/behavioural genes is shared
across all three regimes, but a few core knobs (notably learning_rate
and ensemble_size) flip sign with the buffer. The cluster structure of
the population does the same: under abundant food clusters keep separating,
under tight food they merge.
The raw numbers and side-by-side tables live in stable profile comparison. This post is the narrative.
What was held fixed, what changed
Every run is 1,000 logged steps after a 200-step warmup, single seed (42),
30 founders seeded by independent mutation, mutation rate 0.15 / scale 0.10,
crossover off, GMM
speciation tracking, and selection_pressure="low" (a
small density-dependent reproduction cost, no global carrying-cap term).
The only thing that varies is the resource buffer:
| Variant | Initial resources / agent | Resource nodes | Regen rate |
|---|---|---|---|
| conservative | 8 | 32 | 0.14 |
| balanced | 10 | 34 | 0.15 |
| buffered | 12 | 36 | 0.16 |
The deltas are small on purpose. I wanted to see how sensitive the selection signal is to a modest change in food, not crash one of the simulations.
The three profiles, in numbers
After the 200-step warmup, the populations look very different. After 1000 more steps, they look much more alike:
| Variant | Post-warmup pop | Peak | Mean | Final | Final speciation idx |
|---|---|---|---|---|---|
| conservative | 135 | 137 | 87.8 | 88 | 0.684 |
| balanced | 100 | 120 | 96.4 | 92 | 0.711 |
| buffered | 165 | 171 | 111.1 | 99 | 0.753 |
So the resource buffer mostly stretches the transient. By the end, all three are in the 88–99 range. What it does not equalise is the genome each run ends up with.
Where the genes agreed
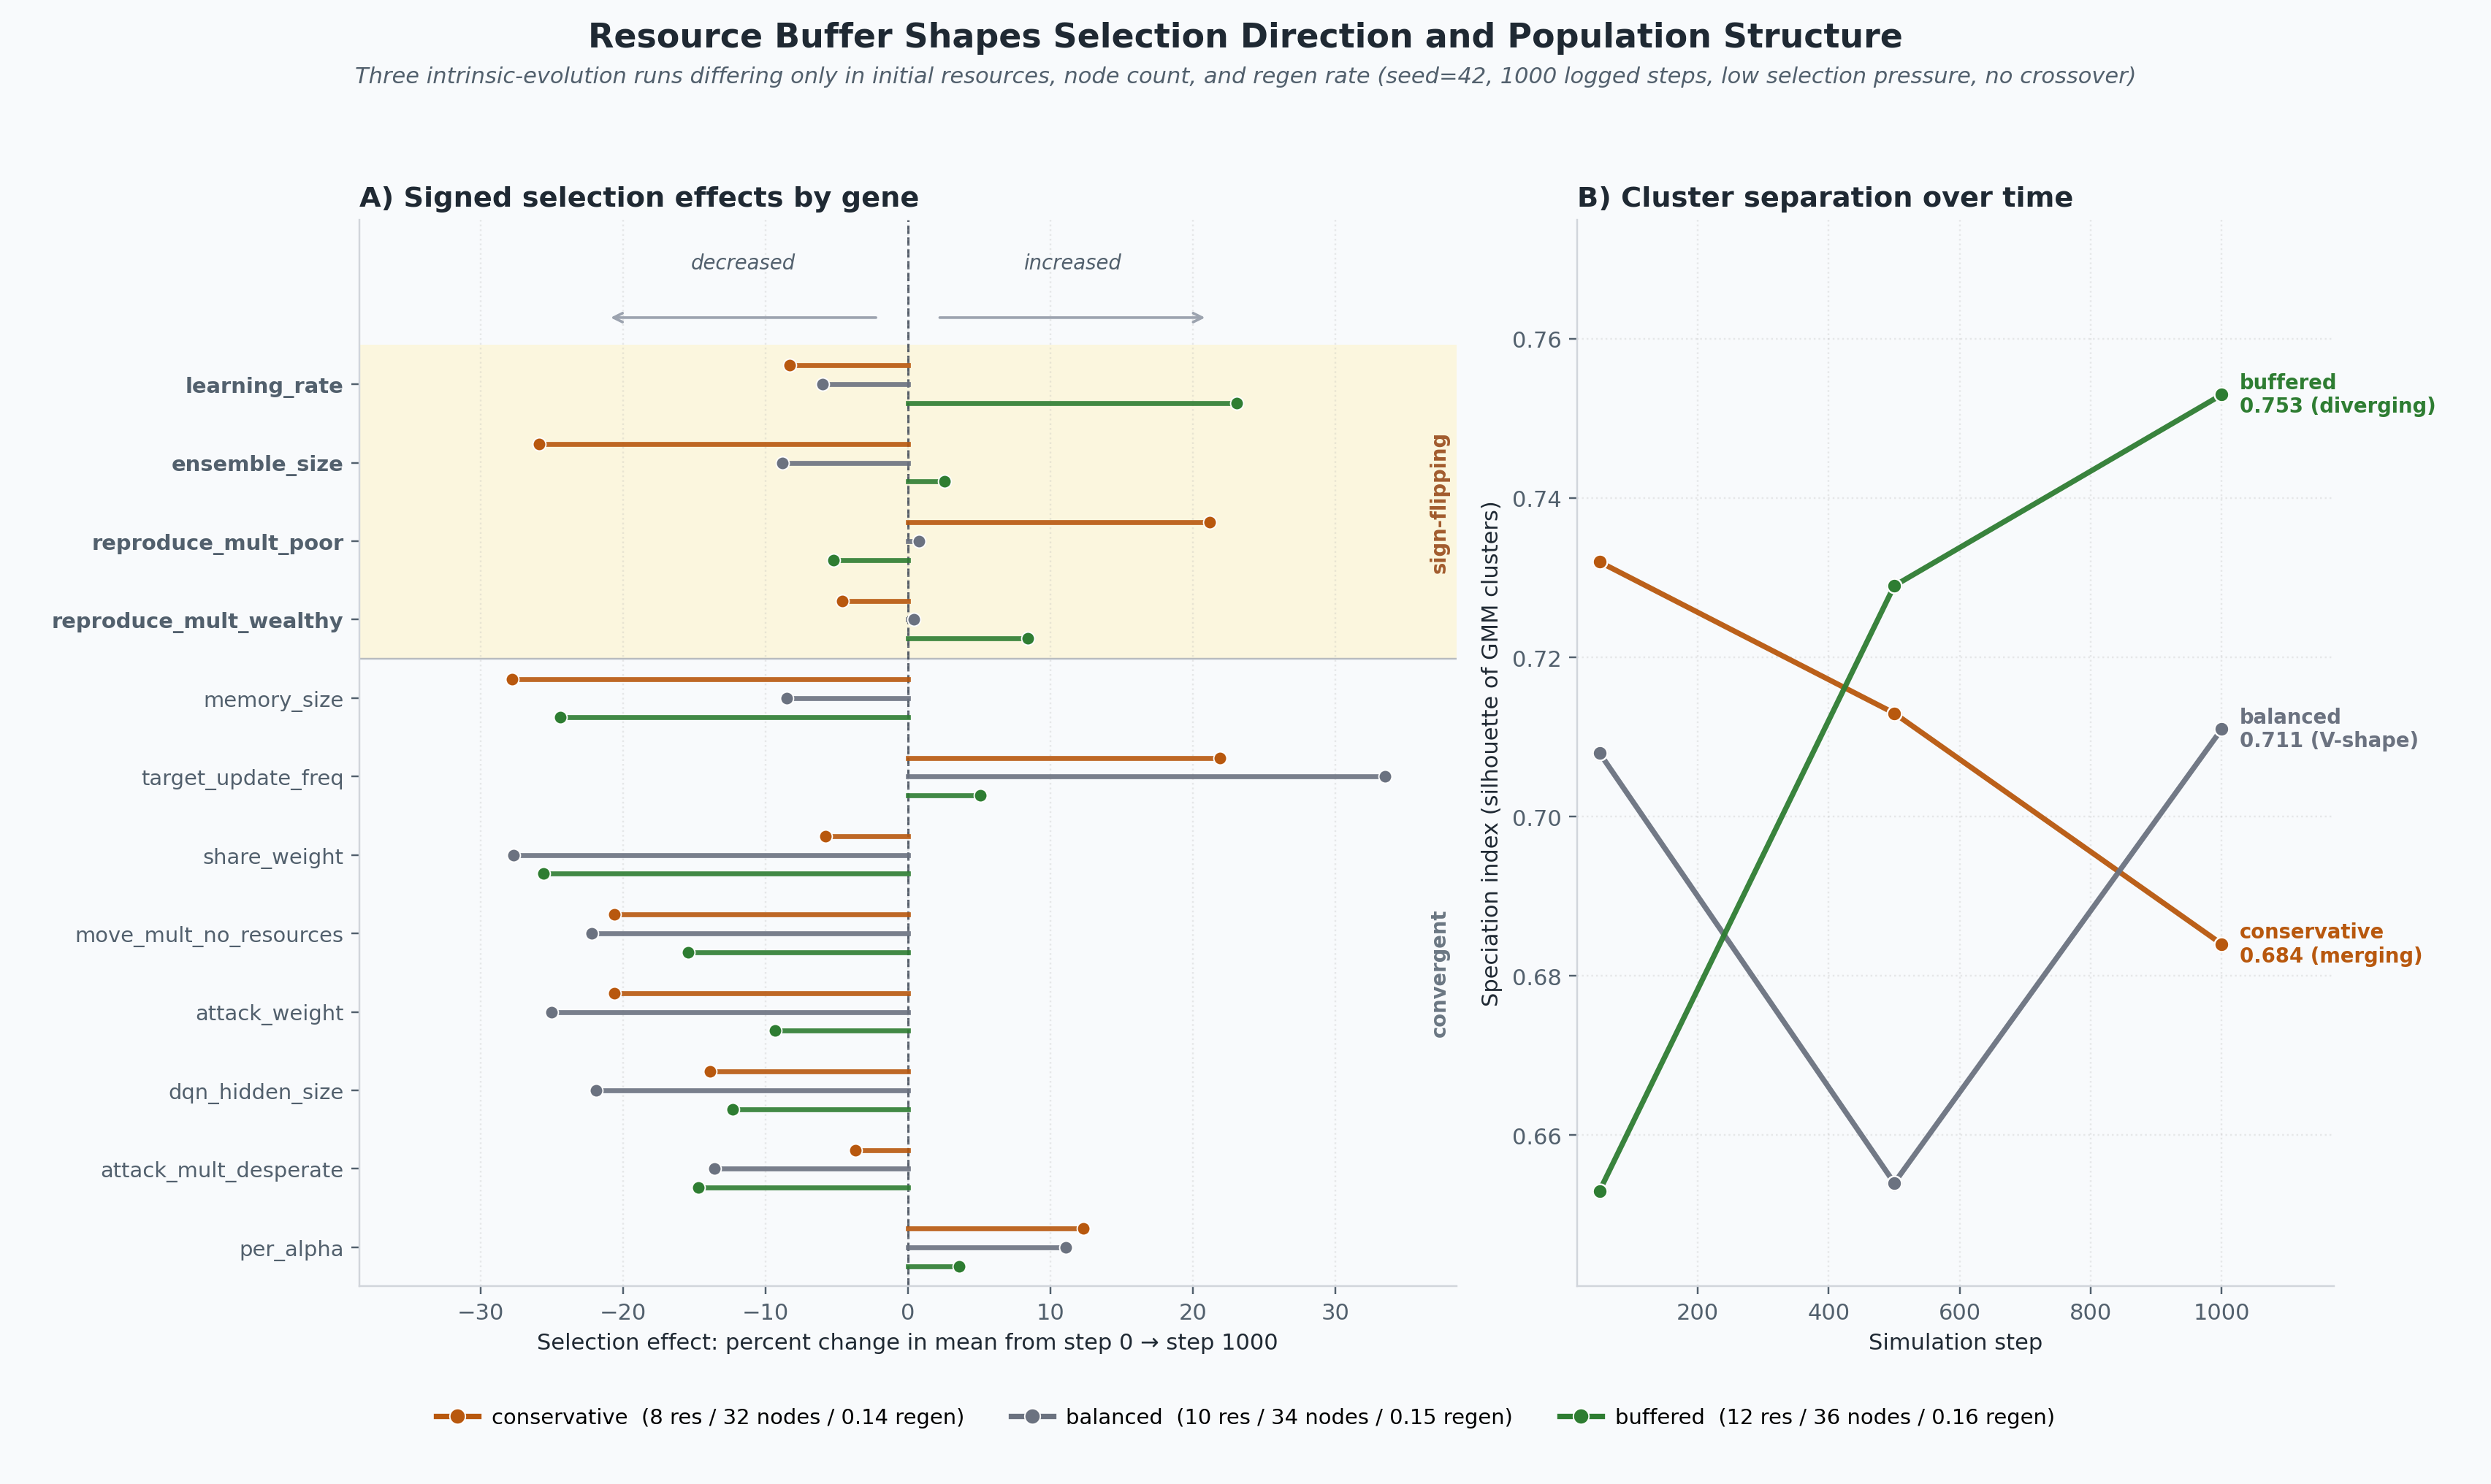
Across all three runs the population drifts in the same direction on the behavioural and ecological knobs. Cheaper, less aggressive, less social, less wandery, smaller networks, and a small but consistent shift toward more prioritised replay and slower target-network syncing:
attack_weightandshare_weightboth fall — by 9–28% depending on variant. Aggression and altruism are both expensive when there is no explicit signal that either one pays off.move_mult_no_resourcesfalls 15–22% in all three. Wandering when hungry doesn’t survive selection.memory_sizefalls 8–28% anddqn_hidden_sizefalls 12–22%. Smaller brains beat bigger brains when the rest of the policy is fixed and reproduction is what matters.per_alpharises 4–12% andtarget_update_freqrises 5–34%. Both are consistent with selection for more stable, less-thrashy learning.
This is the most robust pattern in the comparison: it shows up regardless of how much food the world has. With low selection pressure and no crossover, agents drift toward the cheapest viable behavioural profile.
Where they disagreed
The fun part. A handful of genes flip direction by buffer:
| Gene | conservative | balanced | buffered |
|---|---|---|---|
learning_rate |
-8.3% | -6.0% | +23.1% |
ensemble_size |
-25.9% | -8.8% | +2.6% |
reproduce_mult_wealthy |
-4.6% | +0.4% | +8.4% |
reproduce_mult_poor |
+21.2% | +0.8% | -5.2% |
learning_rate is the clearest one. With more food the population selects
for faster learners (+23% in buffered); with less food it selects for
slower, more conservative updates (-8% in conservative). Balanced sits in
between. There seems to be a real gradient: how aggressive the learning
prior should be depends on how much slack the environment offers a
mistake.
ensemble_size is the most striking single-locus shift in the comparison.
Conservative chops it by 26%, balanced trims it slightly, buffered does
nothing. A “compress the brain when starvation gets close” signature.
The reproduce multipliers tell a coherent story too. Buffered evolves selective reproduction — breed when wealthy, hold off when poor. Conservative evolves opportunistic reproduction — when food is short, the survivors are the ones who reproduce whenever they can, especially when poor.
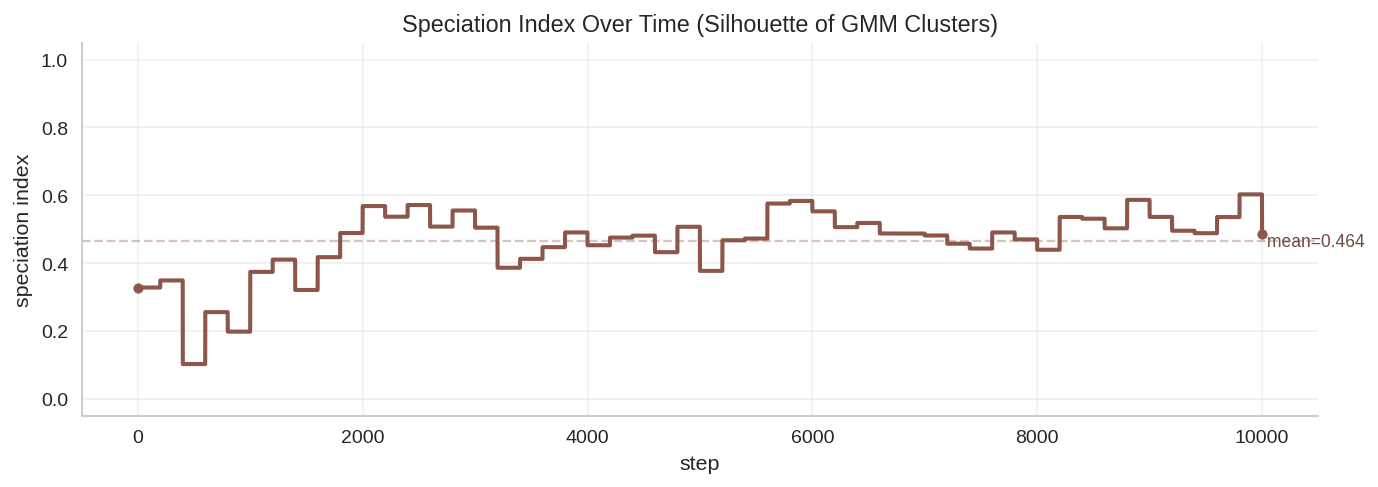
Reading the speciation traces
The speciation index is a silhouette score on chromosome-space clusters (see intrinsic evolution docs). Higher means clusters are better separated. Plotting it over time tells you whether the population is splitting into niches or collapsing back toward one type. The three runs all start in the 0.65–0.73 range and diverge:
- Conservative: 0.732 → 0.713 → 0.684 — monotonically declining. Clusters merge.
- Balanced: 0.708 → 0.654 → 0.711 — V-shape. The population briefly consolidates and then re-splits.
- Buffered: 0.653 → 0.729 → 0.753 — monotonically rising. Clusters separate further over time.
Resource buffer not only sets what evolves on average, it sets how much the population can afford to spread out in chromosome space. With abundant food, sub-populations have room to drift apart from each other. With tight food, the survivors look more and more alike.
Lineage trees
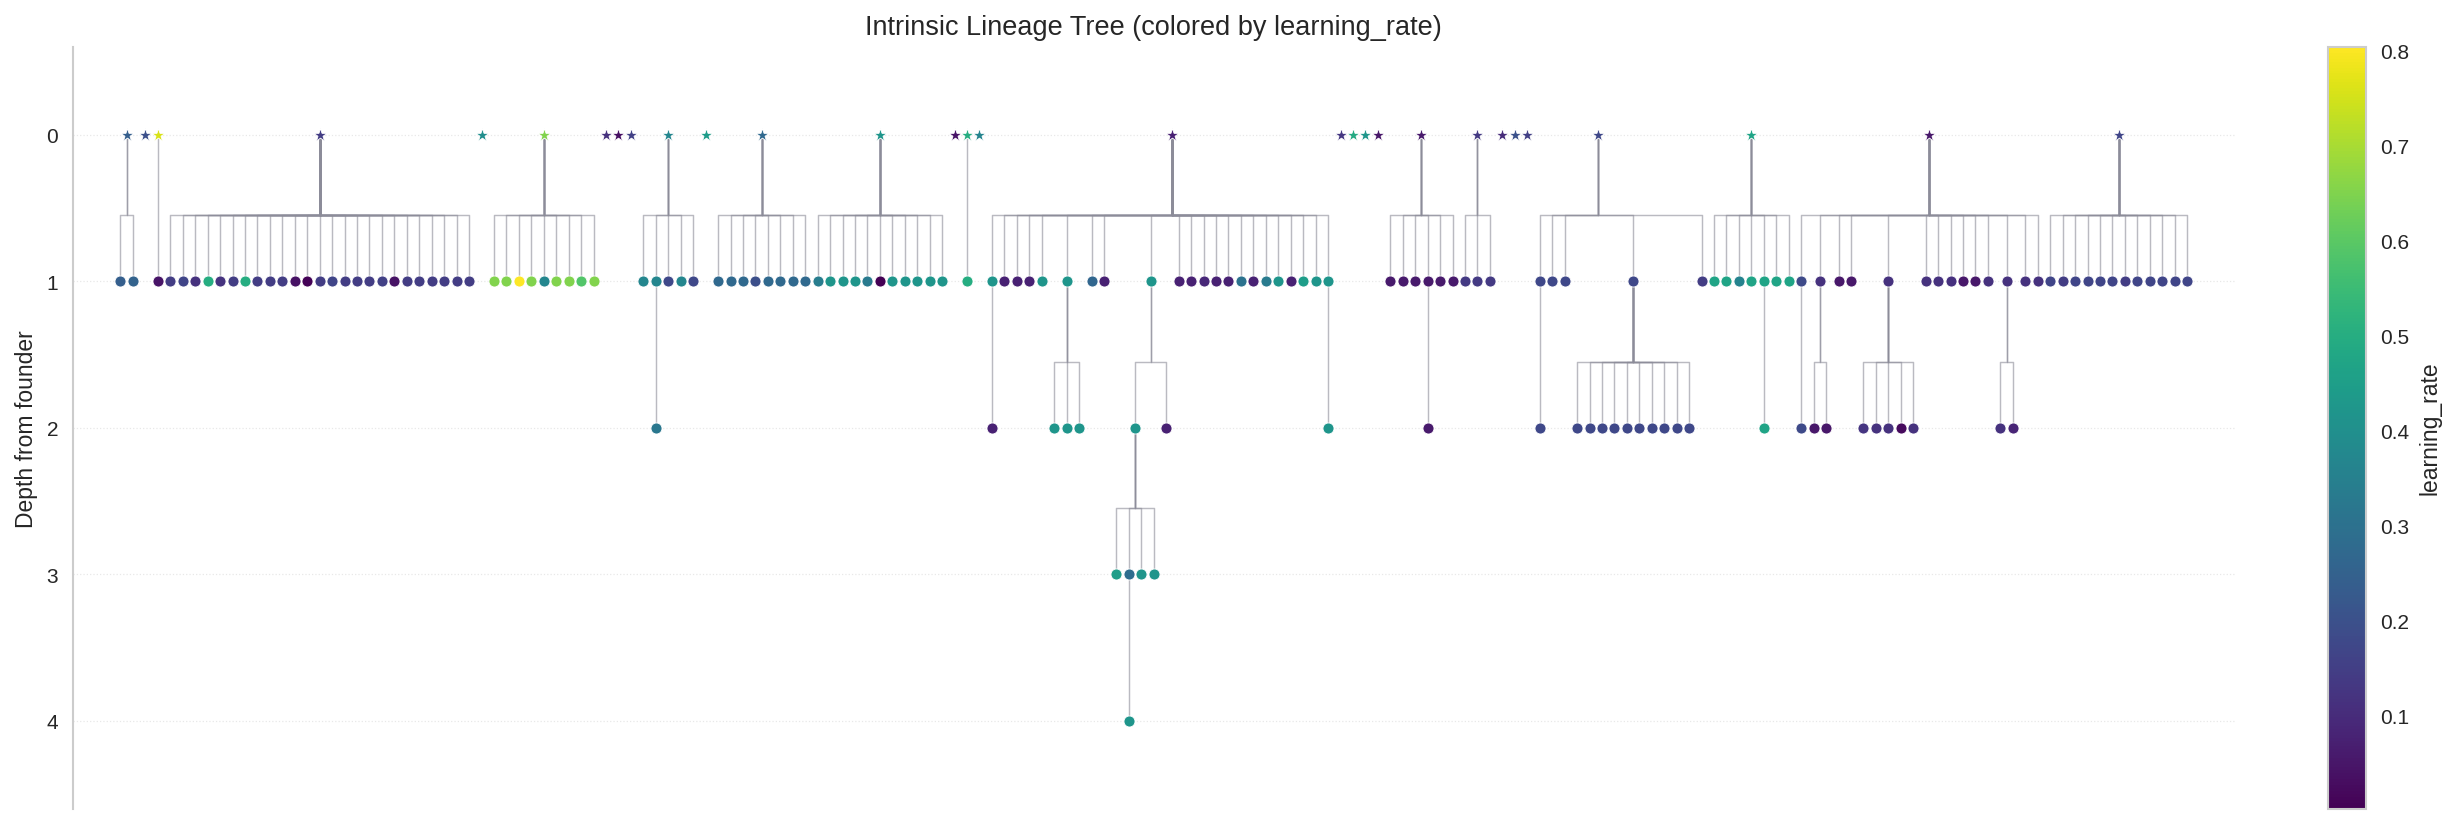
All three runs hit the same maximum lineage depth of 3 (great-grandchildren make it to the final snapshot), but the breadth differs. Buffered keeps the most founders alive at the end (18 of 30), conservative and balanced both keep 15. Conservative has the flattest tree (mean depth 1.011), which together with the falling speciation index suggests a population mostly made up of “founders who never became grandparents”.
What this is and isn’t
This is a single-seed comparison across three closely-spaced resource
regimes. The qualitative pattern — convergent selection on cheapness,
direction flips on learning_rate and ensemble_size, and a clean
buffer-vs-speciation trend — is consistent across all three points,
which is more informative than three runs at the same setting would
be. But every individual number here should be replicated across seeds
before getting too attached to it.
It’s also a low-selection-pressure regime. With a stiffer
selection_pressure="medium" or "high", the convergent shifts on the
ecological genes would probably be sharper, and the buffer-dependent
splits might either amplify or wash out. I haven’t tested that yet.
What’s next
A few obvious follow-ups:
- A small seed sweep per profile (4-8 seeds) to bracket the
speciation-trajectory direction and the
learning_rateshift. - Longer conservative runs to see if the falling speciation index resolves into a single dominant cluster or stabilises around k=2.
Re-run buffered with crossover enabled— done (2026-05-18): rising speciation trajectories survive crossover; see crossover rerun.- Add
stressandlegacyprofiles to widen the buffer axis.
For the full numerical results, side-by-side tables, and per-variant artifact links, see stable profile comparison.